Iniciar sessão
Inscreva-se
Bem vindo à HTX
Mais surpresas esperam por si depois de iniciar sessão!
Inscreva-se
Iniciar sessão
Atividade
Zona $HTX

Meus Ativos
Meus Pedidos
Mensagem
Minha taxa
Minhas recompensas
Minhas referências
Segurança
Configuração de Fiat
Gestão da subconta
Gestão de API
Painel do Corretor
Sair


Mr4Beast
2024/04/15 18:52
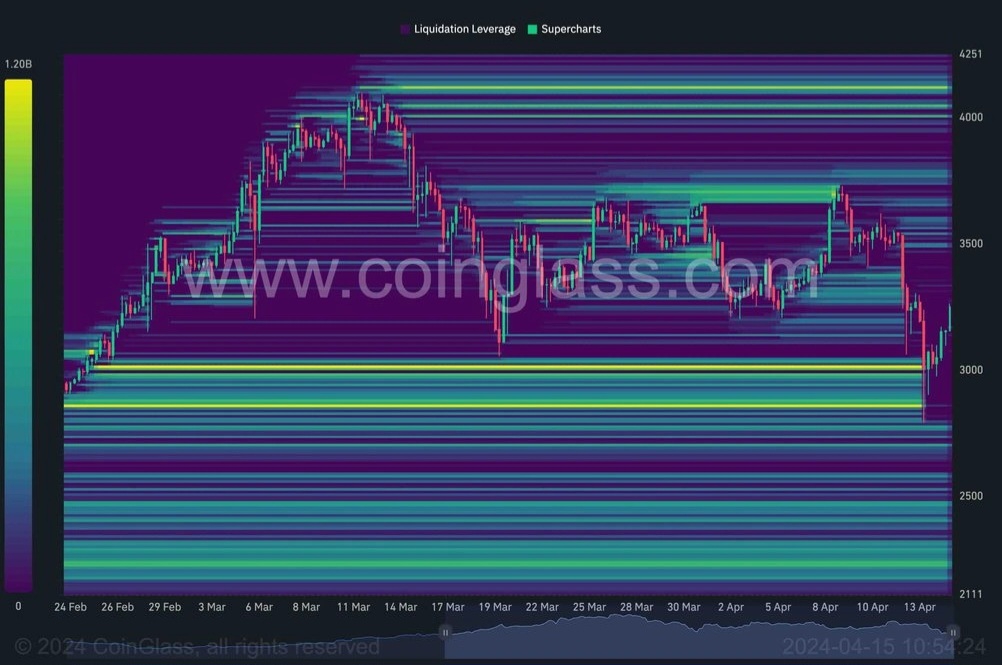
Ethereum Liquidation Heatmap
During the weekend, the price briefly dropped below the $3,000 support level. This area can be considered a critical zone from a technical analysis standpoint. Therefore, many investors might have put their stop losses there.
This chart demonstrates the HTX ETH/USDT pair’s liquidation heatmap. The price’s decline below the $3,000 level has liquidated a considerable portion of the long positions.
As the cryptocurrency is currently recovering, it can be assumed that the selling pressure resulting from these liquidations has been met with sufficient demand, and the recent drop might have been a bear trap. Therefore, the market can target liquidity above the $4,000 level if nothing unexpected happens in the short term.
#Claim 1,000 U in the June Challenge#Explore TOKEN2049 Dubai on HTX#Stablecoins: USDT\UST\USDD
21Partilhar
Todos os comentários9Mais recentePopular
921


加密货币怪咖侠
perfect
2024-04-16 01:37ResponderGosto
lin****@email.com
哈囉,果然是一个有趣的瞬间
2024-04-15 19:55ResponderGosto
ЛеджерСтраж
Great chart
2024-04-15 19:40ResponderGosto
AI币智者
🤔 interesting analysis
2024-04-15 19:38ResponderGosto
钱包守护者
It's amazing
2024-04-15 19:36ResponderGosto
加密货币忍者
我观察到 Market 的回撤很 interessante,particularly the brief drop below $3,000 support level
2024-04-15 19:34ResponderGosto
gra****@proton.me
🤔 Interesting observation
2024-04-15 19:30ResponderGosto
区块链审计师
??? why
2024-04-15 19:24ResponderGosto
jer****@hotmail.com
no problem
2024-04-15 19:24ResponderGosto